Posts
You R My Valentine 4.0
I like to make something myself to show my appreciation for my significant other. So like in 2019, 2020 and 2023 I’m writing some code for my wonderful special R-Lady – which I happen to be better at than at arts and crafts. Last year, we talked a lot about Git, the version control system you might know from GitHub and which is the default for collaborative work on code.

So many new people on Bluesky! Who should I follow?
If there is one development at the moment which I full heartedly enjoy reading about it’s that the remains of what was once called Twitter is seeing a large E𝕏odus. Since a certain billionaire has taken over that platform, it has continuously become worse and I was hoping that politcians, media outlets and my fellow social scientists would come to Bluesky instead, which is apparently exactly what is happening now.

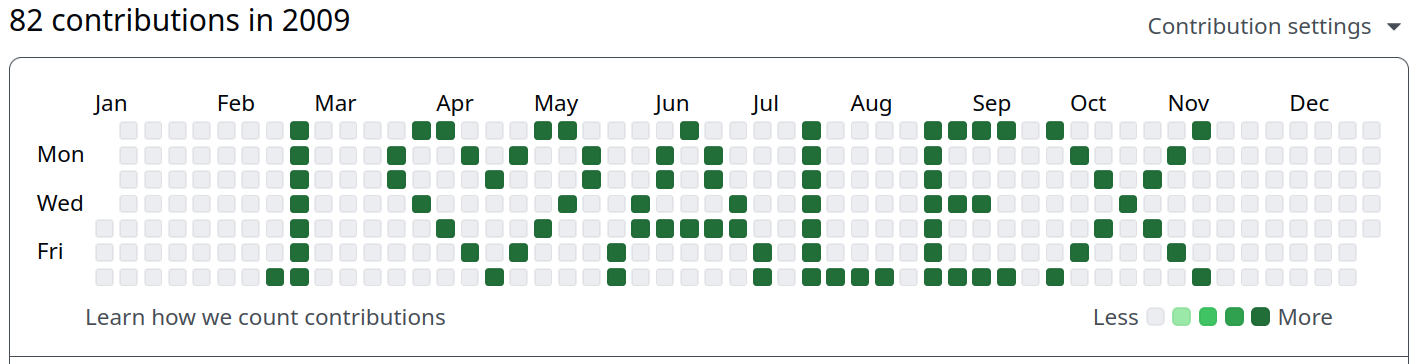
Building the R-Bloggers Bluesky Bot with atrrr and GitHub Actions
Bluesky is shaping up to be a nice, “billionaire-proof”1 replacement of what Twitter once was. One of the things the community was still missing, in my opinion, was the R-Bloggers bot that once spread the news about new R blog posts on ex-Twitter. Especially when first learning R, this was an important resource for me and I created my first package using a post from R-Bloggers. Since I have recently published the atrrr package with a few friends, I thought re-creating the bot that posted new entries was a good opportunity to promote that package and show how you can write a completely free bot with it.
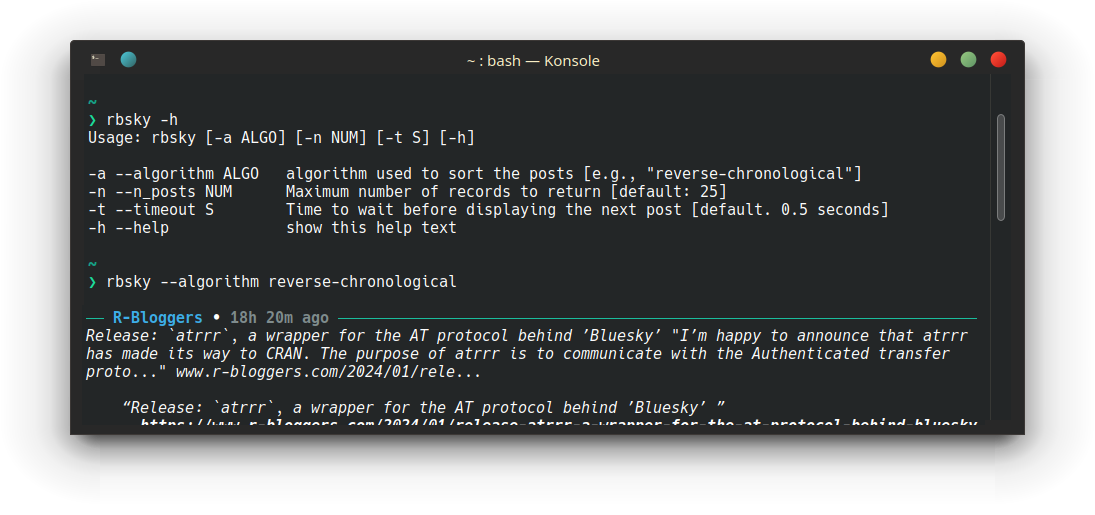
Poor Dude’s Janky Bluesky Feed Reader CLI Via atrrr
Have you ever wanted to see your favourite social media posts in your command line? No? Me neither, but at least hrbrmstr has a few months ago. Or to be honest, I don’t know which social media site he prefers, but Bluesky is currently my favourite. With the ease of use and algorithmic curation that I loved about Twitter before its demise and the super interesting and easy to work with AT protocol, which should make Bluesky “billionaire-proof”1, I’m hopeful that this social network it here to stay.
Release: `atrrr`, a wrapper for the AT protocol behind ’Bluesky’
I’m happy to announce that atrrr has made its way to CRAN. The purpose of atrrr is to communicate with the Authenticated transfer protocol (atproto for short), which powers the Twitter replacement social media site Bluesky. I think there are two things that are especially interesting about the package:
it gives near limitless access to a social network site from R the backbone of the package was written mostly automatically The first point will make this interesting for teaching, as the well of interesting data that the Twitter research API once was has tried out, thanks to a certain billionaire.

Re-Release: `traktok`
I’m happy to announce that traktok, my package to get content from TikTok, has returned from the dead. That’s slightly exaggerated, because it actually always worked in some shape or form, but up until about September, the most recent state on Github had very limited functionality. Now I extended the package substantially and also gave it an appealing home on a pkgdown site here: https://jbgruber.github.io/traktok/.
The main issue I had before, namely that some requests to the unofficial TikTok API need to be signed, still remains unresolved.
CRAN Download counts
I really like developing software and making my own life and work easier with it. But what I enjoy even more is to see others actually use it! So every now and then I look at CRAN download counts of my R packages. I’m not in any top-10 rankings or anything. But that was also never the point. I just like sharing my knowledge and see others use it!
Introducing `askgpt`: a chat interface that helps you to learn R!
Everyone is talking about AI at the moment. So when I talked to my collogues Mariken and Kasper the other day about how to make teaching R more engaging and how to help students overcome their problems, it is no big surprise that the conversation eventually found it’s way to the large language model GPT-3.5 by OpenAI and the chat interface ChatGPT. It’s advantages for learning R (or any programming languages) are rather obvious:
You R My Valentine 3.0!
After a hiatus of three years already(!) I wanted to make another Valentine’s post. Like in 2019 and 2020 I wanted to make something special for my wonderful R-Lady. I tried to figure rayshader out for a while now and tried to make a heart shape map first. After some failed attempts I noticed you can also turn ggplot2 objects into 3-D objects, which is absolutely amazing. So without further ado, here is some code:
scikit-learn models in R with reticulate
I have tried to venture into Python several times over the years. The language itself seems simple enough to learn but as someone who has only ever used R (and a bit of Stata), there were two things that held me back:
I never really found an IDE that I liked. I tried a few different ones including Spyder and Jupyter Notebook (not technically an IDE) and compared to RStudio and R Markdown they felt rather limited.