Everyone is talking about AI at the moment.
So when I talked to my collogues Mariken and Kasper the other day about how to make teaching R more engaging and how to help students overcome their problems, it is no big surprise that the conversation eventually found it’s way to the large language model GPT-3.5 by OpenAI and the chat interface ChatGPT.
It’s advantages for learning R (or any programming languages) are rather obvious:
- you get help on exactly your path to learning – which is different for everyone of us
- you can ask the model anything without anxiety about what it might think of you
- it can answer instantaneously
So I got to work implementing a few of the functionalities I wish I had available when I first started with R. The resulting package was just released on CRAN and I wanted to write this post to highlight a few of the way you can use it to make learning or teaching easier.
You can install it now like so
install.packages("askgpt")Or get the development version:
remotes::install_github("JBGruber/askgpt")A Simple Chat Interface Directly in R
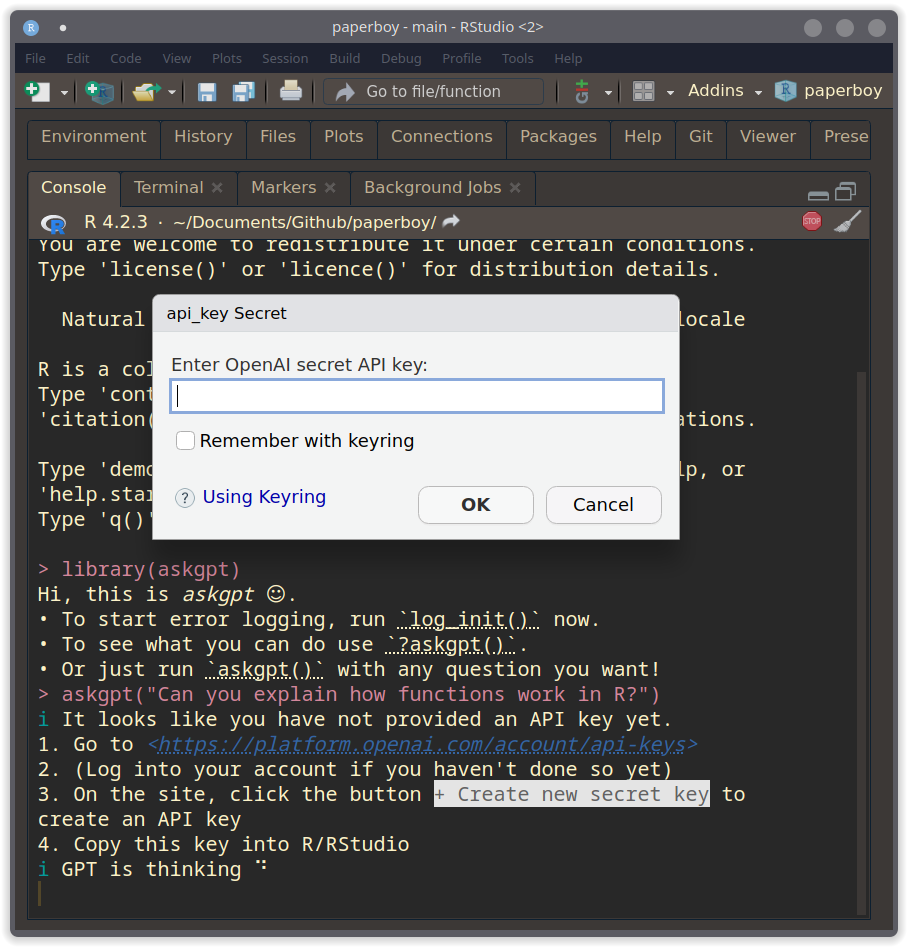
The main function, askgpt(), is very similar to ChatGPT, only directly in R:
library(askgpt)askgpt("Can you explain how functions work in R?")#> Functions in R are a set of pre-defined or user-defined set of instructions that can take inputs, perform specific calculations or operations, and return outputs. Functions can be used to automate repetitive tasks, combine multiple operations into a single step, and create more complex programs.
#>
#> In R, function definitions can be created using the `function()` keyword. The basic syntax of a function definition in R is as follows:
#>
#> ```
#> function_name <- function(argument1, argument2, ...) {
#> # Function code goes here
#> return(output)
#> }
#> ```
#>
#> Here, `function_name` is the name you choose for your function, `argument1`, `argument2`, etc. are the inputs to the function (also called parameters), and `output` is the value that the function returns.
#>
#> To use a function in R, you simply call it by its name and supply any necessary arguments:
#>
#> ```
#> function_name(argument1, argument2, ...)
#> ```
#>
#> R has a large number of built-in functions that perform a wide variety of tasks. For example, the `sum()` function adds up all the values of a given vector, while the `mean()` function calculates the average.
#>
#> In addition to using pre-defined functions in R, you can also create your own custom functions based on your specific needs. By combining multiple functions and operations in a single custom function, you can create powerful tools for data analysis and modeling.askgpt("How do you make a histogram with ggplot2?")#> To make a histogram with ggplot2, follow these steps:
#>
#> 1. Load the ggplot2 library using the `library()` function.
#> ```
#> library(ggplot2)
#> ```
#>
#> 2. Prepare your data. Create a vector or data frame that contains the values you want to plot.
#>
#> 3. Create a ggplot object using the `ggplot()` function. Pass in the name of the data frame as an argument.
#>
#> ```
#> ggplot(data = your_data_frame)
#> ```
#>
#> 4. Add a histogram layer to the plot using the `geom_histogram()` function. Pass in the name of the column you want to use for your histogram as the `mapping` argument.
#>
#> ```
#> ggplot(data = your_data_frame,
#> mapping = aes(x = your_column_name)) +
#> geom_histogram()
#> ```
#>
#> 5. Customize the plot as desired using various ggplot2 functions, such as `labs()` for axis labels and titles, `theme()` for plot themes, and `scale_x_continuous()` and `scale_y_continuous()` for adjusting the axis limits and tick marks.
#>
#> ```
#> ggplot(data = your_data_frame,
#> mapping = aes(x = your_column_name)) +
#> geom_histogram() +
#> labs(x = "X axis label",
#> y = "Y axis label",
#> title = "Histogram Title") +
#> theme_bw() +
#> scale_x_continuous(limits = c(0, 100),
#> breaks = seq(0, 100, 10),
#> expand = c(0, 0)) +
#> scale_y_continuous(limits = c(0, 20),
#> breaks = seq(0, 20, 2),
#> expand = c(0, 0))
#> ```
#>
#> 6. Use the `ggsave()` function to save the plot to a file.
#>
#> ```
#> ggsave(file = "path/to/save/file.png", width = 6, height = 4, dpi = 300)
#> ```
#>
#> Note: Replace `your_data_frame` and `your_column_name` with the actual names of your data frame and column, respectively. Adjust the axis limits and tick marks according to your needs.To make setting things up as easily as possible, the above lines will prompt you to log into your OpenAI account and generate an API key that is automatically saved for the future once entered into RStudio.
The chat also remembers the previous conversation, so you can always ask it to elaborate or explain something differently.
askgpt("I don't understand what you mean. Can you explain this for beginners?")#> Sure, let's break down the steps to create a histogram using ggplot2 in R for beginners:
#>
#> 1. First, you need to load the ggplot2 package in your R session. You can do this by running the following command:
#>
#> ```
#> library(ggplot2)
#> ```
#>
#> 2. Next, you need to import or create a data frame that contains the data you want to plot. For example, let's create a vector of random numbers using the `rnorm()` function:
#>
#> ```
#> my_data <- rnorm(1000, mean = 10, sd = 2)
#> ```
#>
#> This creates a vector of 1000 normal-distributed random numbers with a mean of 10 and a standard deviation of 2.
#>
#> 3. Now, you can create a basic ggplot object using the `ggplot()` function, passing in the name of the data frame as an argument:
#>
#> ```
#> my_plot <- ggplot(data = my_data)
#> ```
#>
#> 4. Then, you can add a histogram layer on top of the ggplot object using the `geom_histogram()` function:
#>
#> ```
#> my_plot <- ggplot(data = my_data) + geom_histogram(binwidth = 0.5)
#> ```
#>
#> Here, `binwidth` is an argument that specifies the size of each histogram bin - we've set it to 0.5, but you can adjust it depending on your data.
#>
#> 5. Finally, you can customize the histogram by adding axis labels, a title, changing the bin width, etc. Here's an example:
#>
#> ```
#> my_plot <- ggplot(data = my_data, aes(x = my_data)) +
#> geom_histogram(binwidth = 0.5, fill = "blue",
#> alpha = 0.5, colour = "black") +
#> labs(title = "My Histogram", x = "Values", y = "Frequency")
#> ```
#>
#> In this example, we've added axis labels and a title to the plot, set the bin width to 0.5, filled the histogram bars with blue and made them semi-transparent with `alpha`, and set the border color to black.
#>
#> 6. You can then display the plot using `print(my_plot)` or simply `my_plot`.
#>
#> ```
#> print(my_plot)
#> ```
#>
#> 7. If you want to save the plot to your computer, you can use the `ggsave()` function:
#>
#> ```
#> ggsave("my_histogram.png", my_plot)
#> ```
#>
#> Here, we're saving the histogram as a PNG file named "my_histogram.png". You can specify the path where you want to save the file, and adjust the height and width using the `width` and `height` arguments.
#>
#> Hope this helps!Error Explanation
One thing that endlessly frustrated me when I first learned R were the sometimes rather cryptic error messages.
askgpt solved this problem by logging your errors and sending them to the OpenAI API when prompted.
This works by default for tidyverse errors, but you need to enable logging first for other error messages:
log_init()
mean[1]
askgpt("What is wrong with my last command?")
#> The error message "object of type 'closure' is not subsettable" occurs when you try to subset or extract a portion of an R function or a closure object, which is not allowed.
#>
#> For example, if you try to index a function by using the `[ ]` operator, the error message will appear. This is because functions are not indexable or subsettable objects in R.
#>
#> Here's an example code that produces this error:
#>
#> ```r
#> # defining a function
#> myFun <- function(x) {
#> x^2
#> }
#>
#> # trying to subset the function with index
#> myFun[1:3]
#> ```
#>
#> When you run this code, you'll get the error message:
#>
#> ```
#> Error in myFun[1:3] : object of type 'closure' is not subsettable
#> ```
#>
#> The error message is telling you that you can't subset the `myFun` function since it is not a data object with indexable elements.
#>
#> To fix this error, you need to make sure that you are not trying to subset or extract a portion of a function or closure object. Instead, you should use the function or closure as it was intended to be used. If you want to extract some value or output from the function, you can assign it to a variable or use it as an argument in another function call.“What is wrong with my last command?” in this case is a special trigger that sends your last error message and the code that produced it.
"help!" is a short alias and does the same thing.
Addin for Teaching
The package also comes with several RStudio addins that solve some common functions for leaning or teaching R and for developing packages.
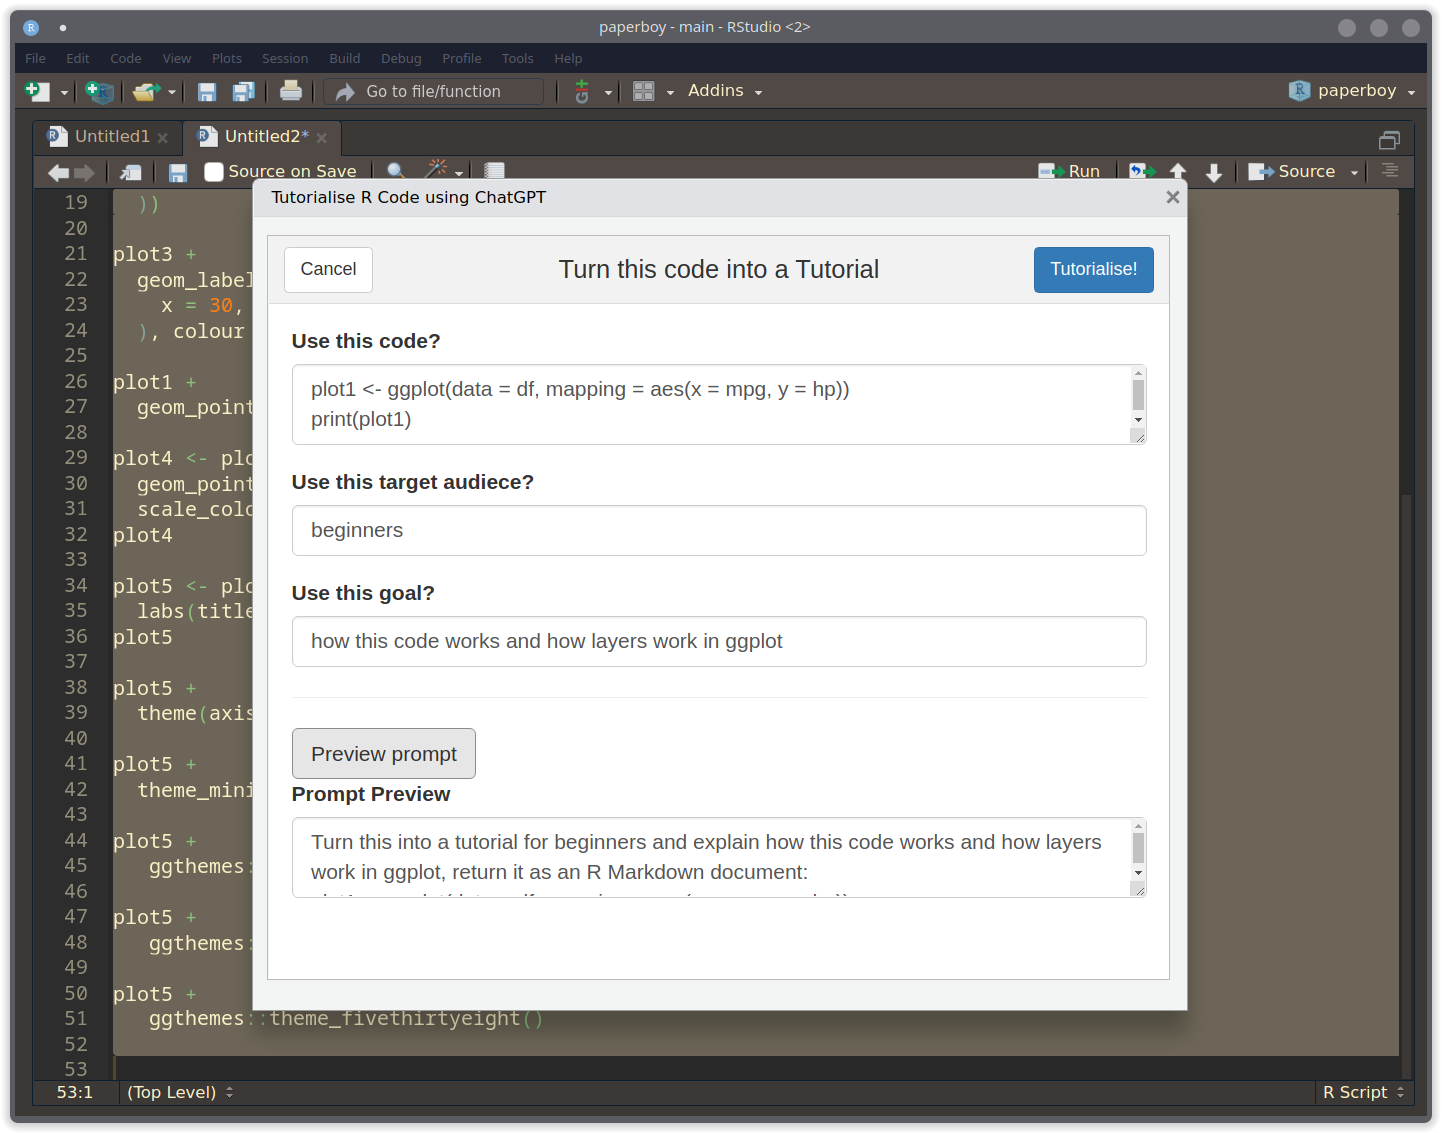
The biggest one is the Tutorialise adding.
Let’s say, you have the code for a tutorial ready and a general plan on how to proceed.
Now the final step is to make this into a class with explanations for the code and some examples.
Highlight the code and select Tutorialise Code from the Addins menu:
Other Addins
At the moment, there are four more addins.
2 targeted at people learning R, two for R developers:
- Explain Code sends the highlighted code to the API and returns the answer in the Console
- Annotate Code adds comments to the highlighted code directly in the R script
- Document Code documents functions using
roxygen2syntax - Write Test creates a
testthatstyle unit test for a highlighted function
Configuration
You can configure how askgpt sends API requests by using options that start with askgpt_*.
For example, to use a different model to use in askgpt() use options(askgpt_chat_model = "gpt-3.5-turbo-0301").
If you use the completions instead of the chat API (chat = FALSE in askgpt()) use options(askgpt_completions_model = "text-curie-001").
It does not matter if the API parameter is listed in the function or not.
All are used.
See the complete list here and here.
The most important setting, however, is askgpt_config.
This can be used to configure the chat using plain English:
options(askgpt_config = "I'm 8 years old, please explain things easily")
askgpt("What is an R function?")
#>
#> ── Answer ──────────────────────────────────────────────────────────────────────
#> An R function is like giving your friend a set of instructions to perform a
#> particular task. In R programming, a function is a set of instructions or steps
#> that is given a name, and when you call that name, the function will perform
#> those instructions. A function can take information or inputs, do something
#> with those inputs (like adding or subtracting), and then give the result back
#> as output.
#>
#> For example, think about giving your friend the instructions to make a peanut
#> butter sandwich. The instructions might be:
#>
#> 1. Take two slices of bread 2. Spread peanut butter on one slice 3. Spread
#> jelly on the other slice 4. Put the two slices together
#>
#> In R, a function might take a number (like 5) and add 1 to it, and then return
#> the result (which would be 6).
#>
#> Functions in R are used to make code easier to use, understand, and reuse. They
#> can also help programmers write complex and efficient programs.Technical Details on the Conversation History
One more rather technical detail about the package is that the conversation history is not kept locally (I mean OpenAI is definitly storing your requests somewhere, but it is not used inside the conversation).
Rather, the questions and answers are stored in the R environment. You can access it using the function prompt_history() and response_history():
prompt_history()#> [1] "Can you explain how functions work in R?"
#> [2] "How do you make a histogram with ggplot2?"
#> [3] "I don't understand what you mean. Can you explain this for beginners?"
#> [4] "explain why this R code does not work:\nNULL\n\"object of type 'closure' is not subsettable\""response_history()#> [1] "Yes, of course! \n\nFunctions in R are like self-contained units of code that perform a specific task. They are used to create reusable code to avoid writing the same task again and again. In R, we use pre-defined inbuilt functions or we create our own functions as per our requirement. \n\nHere's how a simple function works in R:\n\n```r\n# Creating a function:\nmy_function <- function(param1, param2) {\n # Body of the function - this is where the actual work is done\n result <- param1 + param2\n return(result)\n}\n\n# Calling the function:\noutput <- my_function(2, 3)\nprint(output)\n```\n\nIn this example, we defined a function named `my_function` that takes two parameters `param1` and `param2`. Inside the function, we added these two parameters and stored the result in a variable named `result`. Finally, the result is returned from the function using the `return()` statement.\n\nAfter we define the function, we can call it like any other R function. In this case, we passed the values `2` and `3` as the parameters for `param1` and `param2`, respectively. The function then returns the sum of these two values, which is `5`.\n\nThis is a simple example, but in practice, functions in R can be used to carry out complex tasks, handle large amounts of data, and automate various workflows."
#> [2] "To make a histogram with ggplot2 in R, you can use the `geom_histogram()` function which is used to create histograms. \n\nHere is an example code to create a histogram with ggplot2:\n\n```r\n# Load ggplot2 library\nlibrary(ggplot2)\n\n# Create a dataframe\ndf <- data.frame(x = rnorm(1000))\n\n# Create a histogram using ggplot2\nggplot(data=df, aes(x=x)) +\n geom_histogram(binwidth=0.2, fill=\"blue\", color=\"black\") +\n labs(title=\"Histogram of Random Data\", x=\"Value\", y=\"Frequency\")\n```\n\nIn the above code, we first load the ggplot2 library using the `library()` function. Then, we create a dataframe named `df` with 1000 random numbers using `rnorm()`. \n\nNext, we create a histogram using ggplot2 by specifying the dataframe `df` and mapping the variable `x` to the `x` aesthetic using `aes()`. We use `geom_histogram()` to actually create the histogram. We also set the binwidth, fill color, and border color using the `binwidth`, `fill`, and `color` arguments inside `geom_histogram()`. Finally, we add a title and label the x and y-axis using `labs()`.\n\nRunning this code will create a histogram of the random data with binwidth of 0.2, blue fill color, and black border color. The resulting plot should be similar to this: \n\n \n\nNote that you can adjust the binwidth and other parameters as per your requirement to create histograms with different appearance and granularity."
#> [3] "Of course, I'm sorry if my previous answer was not clear enough. Here's a more beginner-friendly explanation.\n\nIn R, a histogram is a graphical representation of the distribution of a set of numerical data. It is used to visualize the frequency distribution of a continuous variable. \n\nWith ggplot2, you can easily create histogram charts with just a few lines of code. Here's how:\n\n1. First, you need to install and load the `ggplot2` library in R by running `install.packages(\"ggplot2\")` and `library(ggplot2)`.\n2. Next, you need to create a dataframe with your data. For example, `df <- data.frame(x = rnorm(1000))` creates a dataframe `df` with 1000 random numbers.\n3. Then, you use the `ggplot()` function to create a ggplot object and specify the dataframe and mapping using the `aes()` function. For example, `ggplot(data=df, aes(x=x))` creates a ggplot object that uses the `df` dataframe and maps the `x` variable to the `x` aesthetic. \n4. Next, you use the `geom_histogram()` function to create a histogram using the ggplot object. For example, `geom_histogram(binwidth=0.2, fill=\"blue\", color=\"black\")` creates a histogram with a binwidth of 0.2, blue fill color, and black border color. You can adjust the `binwidth` and other parameters as per your requirement to create histograms with different appearance and granularity.\n5. Finally, you can add a title and axis labels to the plot using the `labs()` function. For example, `labs(title=\"Histogram of Random Data\", x=\"Value\", y=\"Frequency\")` sets the title of the plot as \"Histogram of Random Data\", and labels the x and y axis respectively.\n\nOnce you have written the code, running it will create a histogram chart of the data that you have provided. You can customize the chart by adjusting the parameters of `geom_histogram` function, such as binwidth, fill color, and border color, etc. \n\nI hope this explanation is more helpful."
#> [4] "The error message \"object of type 'closure' is not subsettable\" occurs when you try to subset or extract a portion of an R function or a closure object, which is not allowed.\n\nFor example, if you try to index a function by using the `[ ]` operator, the error message will appear. This is because functions are not indexable or subsettable objects in R. \n\nHere's an example code that produces this error:\n\n```r\n# defining a function\nmyFun <- function(x) { \n x^2 \n}\n\n# trying to subset the function with index\nmyFun[1:3]\n```\n\nWhen you run this code, you'll get the error message:\n\n```\nError in myFun[1:3] : object of type 'closure' is not subsettable\n```\n\nThe error message is telling you that you can't subset the `myFun` function since it is not a data object with indexable elements. \n\nTo fix this error, you need to make sure that you are not trying to subset or extract a portion of a function or closure object. Instead, you should use the function or closure as it was intended to be used. If you want to extract some value or output from the function, you can assign it to a variable or use it as an argument in another function call."Each time a request is send via the chat API, the entire history is sent as well.
This means that at some point, you will get an error as prompt + response would exceed the token limit of 4,096 tokens.
If this happens, you can start a fresh conversation with new_conversation().
(I only ran into the limitation a day after submitting to CRAN, so this is only available in the development version right now).